Parabola Graph Calculator
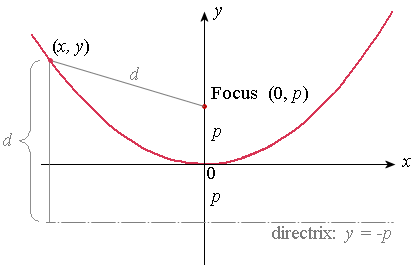
Directrix
d = 1.81
d = 1.81
Click F or P or D and drag to move the image.
Function is a kind of correspondence in mathematics, which is the correspondence from the non-empty number set A to the real number set B. Simply put, if A changes with B, then A is a function of B. To be precise, let X be a non-empty set, Y be a non-empty number set, and f be a correspondence rule. If for each x in X, according to the correspondence rule f, there is a unique element y in Y corresponding to it, then the correspondence rule f is called a function on X, denoted as y=f(x), X is called the domain of the function f(x), the set {y|y=f(x), x∈R} is its range (the range is a subset of Y), x is called the independent variable, y is called the dependent variable, and it is customary to say that y is a function of x. The correspondence rule and the domain are two elements of a function.

